⚡ Mid-2026 Housing Inventory Outlook
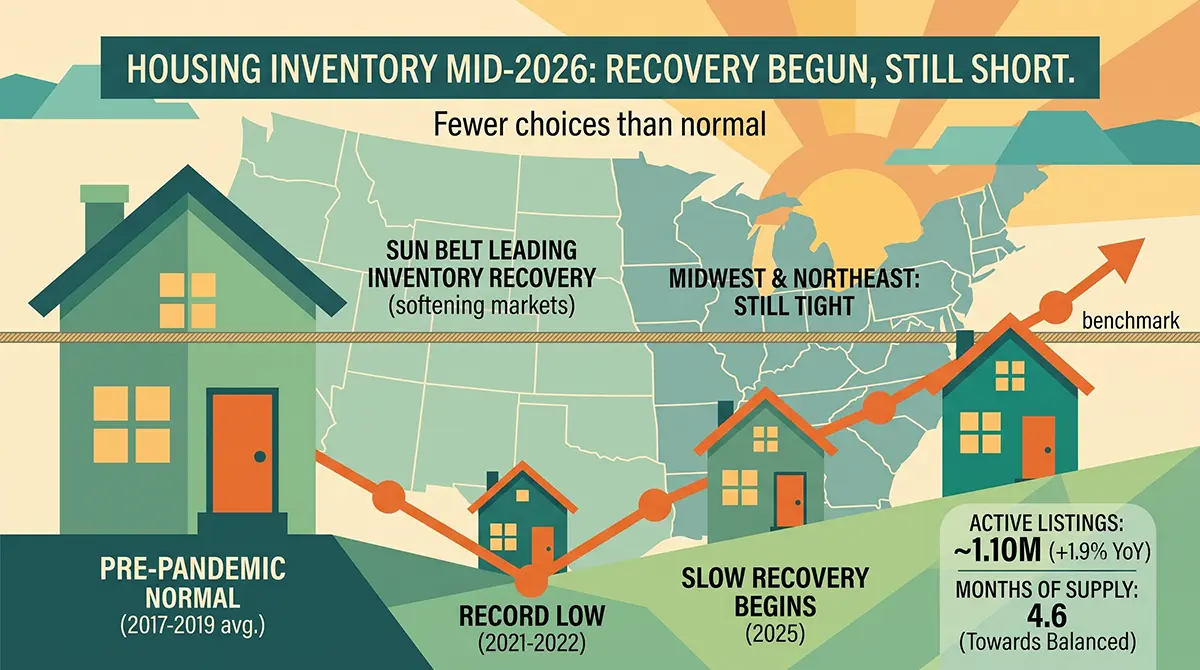
U.S. active listings reached roughly 1.10 million in June 2026, up 1.9% year-over-year — but still about 11% below the 2017–2019 average. The market has loosened to 4.6 months of supply, with the 30-year fixed near 6.55%. The national shortage is still real, but the map has flipped: Sun Belt buyers now have leverage while the Midwest and Northeast stay tight. Calculate your buying power →
Wondering if the housing shortage is finally easing — or if it's still a seller's game out there?
Here's the short version:
Inventory is climbing, but slowly. The U.S. still has fewer homes for sale than it did before the pandemic, and most homeowners are still sitting on mortgage rates far below today's. But the picture in mid-2026 is more nuanced than the "historic shortage" headlines suggest — and in a growing number of markets, buyers finally have the upper hand.
In this guide, you'll get the latest mid-2026 inventory data, a plain-English look at why supply is still tight, an honest scorecard on how this year's forecasts are tracking, and a clear buyer's playbook. You can run your own numbers anytime with our mortgage calculator and affordability calculator.
Let's dig in.
TL;DR: Housing Inventory in Mid-2026
Key Takeaways
- Inventory is up, but still short. Active listings hit about 1.10 million in June 2026 (+1.9% year-over-year) — yet that's still roughly 11% below pre-pandemic (2017–2019) norms.
- The market has loosened to ~4.6 months of supply — closer to balanced, but not a buyer's paradise nationally.
- Mortgage rates are the story. The 30-year fixed sits around 6.55% (mid-July 2026), after briefly dipping below 6% in February. High rates keep the "lock-in effect" alive: roughly 4 in 5 homeowners have a rate below 6%.
- The shortage is real but hard to pin down. Estimates range from about 1 million to 10 million homes depending on who's counting. Mid-range figures cluster around 4–4.7 million.
- The map has flipped. The Sun Belt (Texas, Florida, Arizona) has the most recovered inventory — and is now seeing price cuts. The Midwest and Northeast remain the tightest markets.
- Builders are dealing. About 37% of builders cut prices in July 2026, and roughly two-thirds are offering incentives like rate buydowns.
Ready to see what today's inventory and rates mean for your budget? Run the affordability calculator.
How Big Is the Housing Shortage, Really?
You've probably seen the scary number: the U.S. is short millions of homes. It's true — but the exact figure depends entirely on how you count.
Here's the honest range as of 2026:
| Source | Estimated shortage | Method |
|---|---|---|
| John Burns Research | ~1 million | Current vacancy shortfall |
| Realtor.com | ~4 million | Household formation vs. building |
| Zillow | 4.7 million | Underbuilding vs. demand |
| White House (CEA) | ~10 million | Single-family vs. pre-2008 pace |
In simple terms: there's no single "correct" number, but most mainstream estimates land somewhere around 4 to 4.7 million homes. That's the gap between how many homes exist and how many we'd need for a healthy, affordable market.
One encouraging sign:
Zillow reported in mid-2026 that the deficit held roughly steady at 4.7 million — the first time in years it stopped growing. The gap grew by just ~43,000 homes in the latest year, down from 159,000 the year before. We're not closing the gap yet, but we may have stopped digging.
U.S. Housing Inventory: Mid-2026 Snapshot
Here's where the numbers actually stand, using the latest June 2026 releases.
| Metric | June 2026 | vs. a year ago | vs. pre-pandemic |
|---|---|---|---|
| Active listings (Realtor.com) | ~1,102,600 | +1.9% | ~11% below 2017–2019 avg |
| New listings (Realtor.com) | ~463,500 | +2.4% | — |
| Total inventory (NAR) | 1.56 million | — | — |
| Months of supply (NAR) | 4.6 months | — | ~6 months = balanced |
| Existing-home sales (NAR) | 4.09M pace | +2.8% | — |
| Median existing price (NAR) | $440,600 | +1.8% | Record high for June |
A few things to notice:
Inventory is genuinely rising — but slowly. Active listings are up year-over-year for the first sustained stretch since the pandemic, and new listings are up 2.4%, meaning sellers are cautiously coming back. Delistings (sellers giving up and pulling homes) fell about 10% from a year earlier.
But we're still below normal. That ~1.10 million active-listing count is about 11% under the 2017–2019 average. So even with the improvement, there are fewer choices than a "normal" market would offer.
"Months of supply" is the number to watch. It answers: if no new homes were listed, how long would it take to sell everything at the current pace? At 4.6 months, we're closer to balanced (about 6 months) than we've been in years — but nationally, still tilted slightly toward sellers.
Key Takeaways: The Mid-2026 Snapshot
- Supply is rising — active listings +1.9% YoY, new listings +2.4%, and fewer sellers are giving up and delisting.
- Still below normal — ~1.10 million active listings is roughly 11% under the 2017–2019 baseline.
- 4.6 months of supply is the closest to balanced in years, but a balanced market is about 6 months — sellers still hold a slight edge nationally.
📖 Definition: Months of Supply
The number of months it would take to sell every home currently listed, at the current sales pace, assuming no new listings. Under ~5 months favors sellers; about 6 months is considered balanced; above ~7 months favors buyers.
Curious what a 6.55% rate does to your monthly payment? Try the mortgage calculator.
Historical U.S. Housing Inventory (2000–2026)
To understand why "1.1 million listings" feels tight, look at where we've been. Active for-sale inventory used to run far higher.
| Year | Active listings (approx.) | Note |
|---|---|---|
| 2000 | 2,100,000 | Pre-bubble normal |
| 2006 | 3,450,000 | Bubble peak (oversupply) |
| 2019 | 1,400,000 | Pre-pandemic baseline |
| 2020 | 1,020,000 | Pandemic buying frenzy |
| 2021 | 950,000 | Record low |
| 2025 | ~1,080,000 | Slow recovery begins |
| 2026 (June) | ~1,102,600 | Realtor.com active-listing count |
Figures are approximate and drawn from multiple sources (Realtor.com, NAR, Census) whose definitions of "inventory" differ, so treat the long-run series as directional rather than an exact apples-to-apples comparison. The "~11% below pre-pandemic" gap cited above uses Realtor.com's own 2017–2019 active-listing baseline.
The takeaway: today's inventory is recovering from the 2021 record low, but it's still below a normal pre-pandemic market. We are nowhere near the oversupplied conditions of 2006.
The "Lock-In Effect": Why Homeowners Still Won't Sell
Here's the single biggest reason inventory stays tight: most homeowners are financially trapped by their own low mortgage rate.
Think about the math.
Say you bought in 2021 with a 2.875% rate on a $300,000 loan — that's about $1,650/month. To move today, you'd likely face a 6.5% rate on a pricier home. On a $450,000 mortgage, that's about $2,950/month — roughly $1,300 more every month for a comparable house.
$300K loan @ 2.875% (2021)
$450K loan @ 6.5% (2026)
Principal and interest only. That's about $15,600 more per year — for a house that may not be meaningfully better.
Would you give that up? Most people won't. That's the lock-in effect.
The latest data (FHFA National Mortgage Database, Q1 2026) shows how deep it runs:
📊 The Lock-In Effect By The Numbers
- ~78% of homeowners with a mortgage have a rate below 6%
- ~67% are below 5%
- ~50% are still below 4%
- ~1 in 6 homeowners say they're staying put specifically to keep their low rate (late-2025 survey)
There's a subtle shift worth noting, though.
For the first time in five years, more homeowners now have a rate above 6% than below 3%. As people move for life reasons — jobs, family, divorce, death — the ultra-low-rate pool slowly shrinks.
Translation: lock-in is easing at the edges, but it's still the dominant force keeping resale inventory scarce.
Regional Breakdown: The Map Has Flipped
If there's one thing that changed most in 2026, it's this: the housing shortage is now deeply regional. A national average hides two very different markets.
| Most recovered inventory | Tightest markets |
|---|---|
| Sun Belt & Mountain West Texas, Florida, Arizona, Colorado, Georgia, Tennessee, the Carolinas |
Midwest & Northeast Ohio, Illinois, New Jersey, Connecticut, Massachusetts, upstate New York |
| 17 states now hold more active inventory than in 2019 | Built the least; still the most supply-constrained vs. 2019 |
| Dozens of large metros posting YoY price declines | Prices still climbing (Columbus ~+4% YoY) |
| Buyers have real negotiating leverage | Inventory growing fastest (NE +8.5%, MW +7.3% YoY) — but from a very low base |
Sources: ResiClub state inventory update (July 2026), Realtor.com June 2026 Housing Report
Where Inventory Has Recovered Most (Sun Belt & Mountain West)
By mid-2026, 17 states had more active inventory than they did in 2019, including Texas, Florida, Arizona, Colorado, Georgia, Tennessee, and the Carolinas. These are the states that built aggressively and drew pandemic migration.
Here's the twist:
Recovered inventory means buyers now have leverage there. As of early 2026, dozens of the 300 largest markets posted year-over-year price declines. Austin, for example, sat roughly 28% below its 2022 peak. Miami, Nashville, Austin, San Antonio, and Las Vegas flipped into clear buyer's markets.
Where It's Still Tight (Midwest & Northeast)
These regions built the least and are the most supply-constrained relative to 2019. Interestingly, they're also where inventory is now growing fastest (Northeast active listings +8.5% YoY; Midwest +7.3% in June 2026) — but from a very low base. Prices in metros like Columbus have kept climbing (~+4% YoY) even as the Sun Belt cools.
🌴 The Florida Footnote
- After being the epicenter of the 2025 correction, Florida's inventory glut is now being absorbed.
- Its active listings actually fell year-over-year in mid-2026.
- It's become a "split-market" story rather than a one-way slide — coastal condo markets and inland single-family markets are behaving very differently.
What this means for you: The national headline is close to useless for your decision. A buyer in Austin or Tampa has real negotiating power right now. A buyer in Columbus or Boston does not. Check active listings and days-on-market for your metro before assuming anything.
What Caused the Housing Supply Crisis?
The shortage didn't happen overnight. Four forces stacked up over 15 years.
1. The Great Recession Hangover
After the 2008 crash, homebuilding collapsed and never fully recovered. For over a decade, builders averaged about 1.0 million homes/year — down from the pre-2008 pace of ~1.5 million. That cumulative underbuilding is the foundation of today's gap.
📊 The Underbuilding Gap
- Pre-2008 average: ~1.5 million homes built per year
- Post-2008 average: ~1.0 million homes per year
- Annual shortfall: ~500,000 homes/year
- Cumulative gap: 5+ million homes never built
Many builders went bankrupt during the recession. Those who survived became more cautious, focusing on higher-margin luxury homes rather than starter homes.
2. The Pandemic Perfect Storm
2020–2021 combined record-low rates, remote work, and a rush to buy. Demand exploded while listings dried up, pushing inventory to an all-time low and prices to new highs.
- Record-low rates (sub-3%) made buying cheaper than renting in many markets
- Remote work untethered buyers from expensive urban centers
- Stimulus money boosted down payment savings
- Construction slowdowns from COVID restrictions and supply chain chaos
3. The Lock-In Effect
As covered above, the rate gap between old and new mortgages froze the resale market — the largest source of homes for sale. Tens of millions of homeowners who refinanced at 2.5–3.5% now face a 6.5% market. The rational choice is to stay put.
4. Zoning and Regulatory Barriers
Restrictive local zoning, permitting delays, and land costs make it slow and expensive to build the "missing middle" — townhomes, duplexes, and starter homes — where the shortage is worst.
📊 Regulatory Constraints
- 60% of residential land in the 240 largest metros is restricted to 2–3 story buildings
- Vacant buildable land near city centers has dropped from 70% (1960s) to about 40% today
- Average completion time for new homes remains near all-time highs
- Goldman Sachs finding: Reducing regulations to the level of the least restrictive 25% of cities would add 2.5 million homes over 10 years
How Tariffs Are Affecting Construction Costs
New homes are one of the few ways to actually add supply — and in 2026, building them got more expensive thanks to tariffs on materials.
Here's the accurate, current picture — and the specifics matter, because these details are easy to garble:
| Material | Tariff rate | Detail |
|---|---|---|
| Softwood lumber | 10% | Section 232, effective October 2025. It did not rise to 30% — that figure applies to imported furniture, not framing lumber. |
| Canadian softwood lumber | ~35% (AD/CVD) | Separate antidumping/countervailing duty stacked on top — a combined burden near 45%. Preliminarily set to drop toward ~25% in mid-2026. |
| Kitchen cabinets & vanities | 50% | Raised effective January 1, 2026. |
| Steel & aluminum | 50% | Section 232. |
Sources: Federal Register Section 232 timber/lumber proclamation; NAHB analysis of Canadian lumber duties.
What does it add up to per house? In a 2025 builder survey, the National Association of Home Builders estimated tariff actions add roughly $10,900 to the cost of a typical new home. Estimates vary — this is a builder-survey estimate, not a measured invoice.
Canada supplies about 85% of U.S. softwood lumber imports, and the U.S. can't simply flip a switch to domestic production: sawmills take years to ramp up capacity.
🏠 The Tariff Contradiction
Federal and state programs are working to relieve the housing shortage through tax credits, grants, and zoning reforms. Meanwhile, tariffs on the very materials needed to build homes push in the opposite direction.
That cost gets passed to buyers — which works directly against the goal of adding affordable supply.
2026 Forecast Scorecard: How the Predictions Are Tracking
Back in December, the industry made a set of 2026 predictions. We're halfway through the year — so how are they holding up?
Here's an honest grade:
| 2026 forecast (late 2025) | Where it stands mid-2026 | Verdict |
|---|---|---|
| Active listings +8.9% | Growing only ~+3.6% (Realtor.com cut it) | ❌ Too optimistic |
| Existing sales 4.13–4.26M | Running at ~4.09M; full-year ~4.10M | ⚠️ Low end |
| Mortgage rates 6.0–6.5% | Averaging ~6.3–6.5% | ✅ On track |
| Price growth +1.2–2.2% | Realtor.com cut its full-year forecast to +1.2% | ✅ Low end |
| Rent −1.0% | Running ~−1.2% | ✅ Roughly right |
Note on the price figure: the +1.2% here is Realtor.com's revised full-year 2026 home-price-growth forecast, corroborated by the S&P Case-Shiller national index (~+0.8% YoY in April 2026). That's a different metric from the +1.8% in the snapshot table above, which is NAR's change in the median existing-home sale price — median price and repeat-sales price indices move differently, so the two aren't contradictory.
The big miss: inventory. Everyone expected sellers to flood back in 2026. They didn't. Listings are growing at less than half the predicted pace — the lock-in effect proved stickier than forecasters assumed.
Prices are barely moving. Price-index growth has cooled to about 1%, which means that after inflation, home prices are actually falling in real terms. That's quietly good news for buyers who've waited.
🔭 Looking to 2027
- Fannie Mae expects rates to hold around 6.3% through 2027, with home sales finally picking up (~+7%) as more inventory trickles in.
- The Mortgage Bankers Association sees rates "stuck" in the 6.0–6.5% band for the next few years.
- Translation: don't bank on a sub-6% rescue.
When Will Housing Inventory Recover?
The honest answer: gradually, over years — not in one dramatic drop.
Three things would speed it up:
- Lower mortgage rates. If the 30-year fixed fell decisively below 6%, some locked-in owners would finally list. Forecasters don't expect that in 2026.
- More building. Completions are running near 1.4 million/year — solid, but single-family starts have actually dipped as builders pull back on weak demand.
- Life happening. Every year, jobs, families, and retirements force moves regardless of rates. This slow churn is the most reliable source of new inventory.
What won't happen (barring a recession): a sudden inventory flood that crashes prices. The structural shortage is too deep for that.
📋 Recovery Timeline Summary
Through 2026
Slow grind. Active listings growing ~3–4% — less than half the pace forecasters expected in December. Sun Belt keeps loosening; Midwest and Northeast stay tight.
2027–2028
Fannie Mae sees rates near 6.3% and sales up ~7%. A decisive move below 6% would release a meaningful share of locked-in owners — but no major forecaster is currently calling for it.
By 2030
Pent-up demand likely supplied, but a structural deficit of several million homes may persist. True "balance" is unlikely without policy change on zoning and construction costs.
Wild Cards
- Recession: could trigger distressed sales, rapidly increasing inventory
- Rate cuts: sub-5% rates would unleash both buyers and sellers
- Policy changes: zoning reform could unlock millions of homes
- Tariff relief: the Canadian lumber duty dropping toward ~25% would ease new-build costs
Strategies for Buyers in Today's Market
Whether inventory is tight or loosening near you, here's how to play mid-2026 smartly.
1. Know Your Local Market, Not the National Headline
A buyer in Austin or Tampa has real negotiating power right now. A buyer in Columbus or Boston does not. Check active listings and days-on-market for your metro before assuming anything about leverage.
2. Negotiate — Especially on New Construction
This is one of the best deals in the market right now.
📊 Builders Are Dealing (July 2026)
- 37% of builders cut prices outright
- ~two-thirds are offering incentives — most commonly mortgage rate buydowns
- Builder sentiment sits at 34 (below 50 = more builders view conditions as poor than good)
With incentives this widespread, you can often get a rate buydown or closing-cost credit that beats haggling on the sticker price — and a buydown lowers your payment every month, not just at closing.
3. Marry the House, Date the Rate
If you find the right home at today's ~6.5%, you can refinance later if rates fall. Run the scenarios with our refinance calculator before you commit — and check the break-even point, since closing costs mean a refinance only pays off if you stay long enough.
4. Get Your Numbers Airtight First
Before you shop, know exactly what you can afford. Use the affordability calculator to find your realistic price ceiling, then the mortgage calculator to model the full payment including taxes, insurance, and PMI — then get pre-approved. In competitive markets, a pre-approval letter isn't optional.
Key metric: Keep your debt-to-income ratio below about 36% for a comfortable payment. Lenders will check it, so you should too — and see our mortgage rates guide for how your credit profile changes the rate you're quoted.
5. Don't Wait for a Crash That Isn't Coming
With the shortage this structural, betting on a big price drop is risky. Focus on what you can control: your budget, your rate strategy, and your local timing.
And here's the math most people miss: if rates drop significantly, everyone rushes to buy, potentially driving prices up more than you'd save on interest. Use our rent vs. buy calculator to see which option actually makes financial sense for your situation.
Frequently Asked Questions
Next Steps: Navigate the Market With Confidence
Inventory is slowly improving, rates are holding near 6.5%, and in a growing list of markets, buyers finally have leverage. The smartest move isn't to time the market — it's to know your numbers cold so you can act fast when the right home appears.
Start here: run the Home Affordability Calculator to lock in your real budget, then the Mortgage Calculator to see your monthly payment at current rates, then use the Rent vs. Buy Calculator to pressure-test whether buying beats renting in your market.
Your Next Step
Before you start house hunting, know exactly where you stand financially:
Helpful Resources
- Mortgage Rates Today – Check current rates to use in your calculations
- How Amortization Works – Understand how your payments split between principal and interest
- Mortgage Rates Guide – The definitive guide to navigating today's mortgage rates
Sources
- National Association of Realtors — Existing-Home Sales, June 2026
- Realtor.com — June 2026 Housing Report and Midyear 2026 Forecast Update
- Freddie Mac — Primary Mortgage Market Survey (6.55%, week of July 16, 2026)
- U.S. Census Bureau / HUD — New Residential Construction, June 2026
- S&P Cotality Case-Shiller Home Price Index, April 2026
- Zillow — U.S. housing deficit held steady at 4.7 million units (2026)
- FHFA — National Mortgage Database, Q1 2026 (mortgage rate distribution)
- NAR — 2025 Profile of Home Buyers and Sellers (first-time buyer age 40, 21% share)
- Fannie Mae Economic & Strategic Research, July 2026; Mortgage Bankers Association 2026 forecast
- NAHB — How Tariffs Impact Home Building (~$10,900 per home) and Canadian lumber duty analysis
- Federal Register — Section 232 timber and lumber proclamation (October 2025)
- ResiClub — State inventory update, July 2026
About Jon Teera
Jon Teera is the Lead Developer and Founder of CalcLogix. Unlike traditional financial writers, Jon approaches personal finance as a data engineering problem. He rebuilt this guide around the June/July 2026 primary releases — NAR, Realtor.com, Freddie Mac, FHFA — and graded the industry's own 2026 forecasts against what actually happened, rather than restating headlines.
Read more about how we verify data →